Google Summer of Code 2022 - Stellar Group
This post is about my contribution to the HPX Concurrency and Parallelism library, for GSoC 2022.
Overview
This summer, I joined Ste||ar Group (based in Louisiana State University) as a contributor through Google Summer of Code (GSoC). I contributed to the HPX project, which is a C++ Standard Library for Concurrency and Parallelism.
My project? HPX Algorithm Performance Analysis & Optimization
To explain further:
The C++ standard library defines functions for commonly used algorithms (eg. sorting, searching). HPX provides sequential and parallel implementations for all these algorithms.
My GSoC project involved performance analysis and optimization for these implementations.
My mentors were Giannis Gonidelis and Hartmut Kaiser.
Completed Work
Performance analysis with custom benchmarks
- Writing small C++ benchmark programs for different algorithms / implementations
- Building & running them while changing various different parameters (workload, CPU cores, grain size)
- Performing runs on different machines & configurations
- Comparing performance of HPX implementations to other parallelism libraries (Intel TBB)
- Collecting timing data and creating useful visualizations using various metrics (i.e. strong/weak scaling, thread utilization charts)
- Automating all above process for quick turnaround time
Use of profiling tools
- Instrumenting existing code for profiling with Intel VTune
- Using existing HPX utilities or adding new as needed
Observations & new implementations
- Using collected data to make observations, find bottlenecks and modify existing implementations
- No PRs yet, but made many interesting (expected and unexpected) observations. Laid the foundation for work to follow
Links
- Github Repo for benchmarking-visualization: https://github.com/Pansysk75/HPX-Performance-Benchmarks
- Github compare for algorithm implementations: https://github.com/Pansysk75/hpx/compare/master...Pansysk75:hpx:scan_partitioner_dataflow_f2
- Ste||ar Group first evaluation blogpost: https://stellar-group.org/2022/08/gsoc-22-first-eval-update
Examples
Our work wasn’t a simple feature implementation but rather more exploratory in nature. Here are a few examples of the processes we developed, in order to discover areas of improvement:
Scaling Visualizations
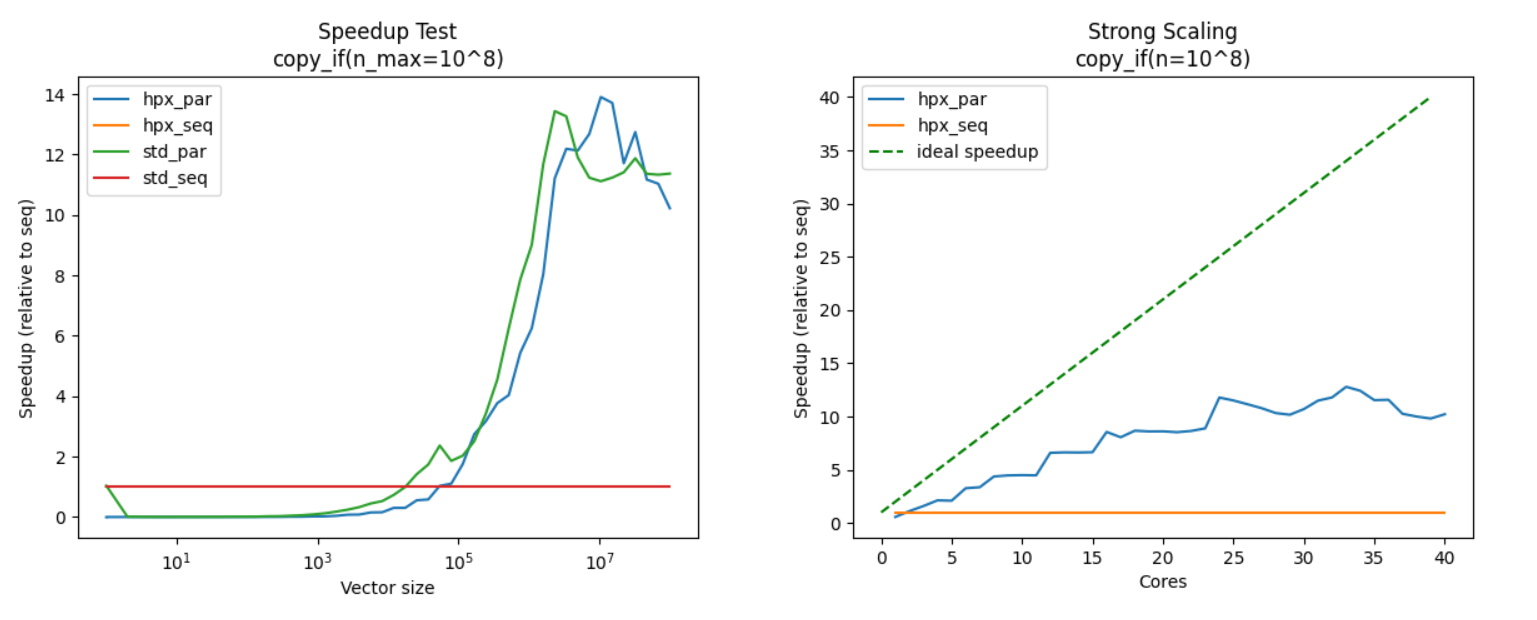
Above are two fundamental visualizations: Speedup Graph and Strong Scaling.
For all performance metrics, it’s crucial to take a lot of samples, then take the average (see next section). A single measurement will not be accurate!
Speedup Graph
The Speedup Graph shows the speedup (duh!) of our parallel (“par”) implementations compared to the sequential one (“seq”).
For a constant workload, speedup is defined as follows:
We can see that for small workloads ( < 10^5 ) , the speedup is < 1 . That means that, for small workload, parallel implementations are often slower that sequential ones!
Strong Scaling
The Strong Scaling graph shows us how speedup scales when we throw in more cores, for a constant workload.
Ideally, speedup would increase proportionally to the number of cores (for example, 20 cores -> speedup of 20). This is however never the case, due to parallelization overhead, inefficiencies, and additional work that a parallel implementation may require.
Individual data points
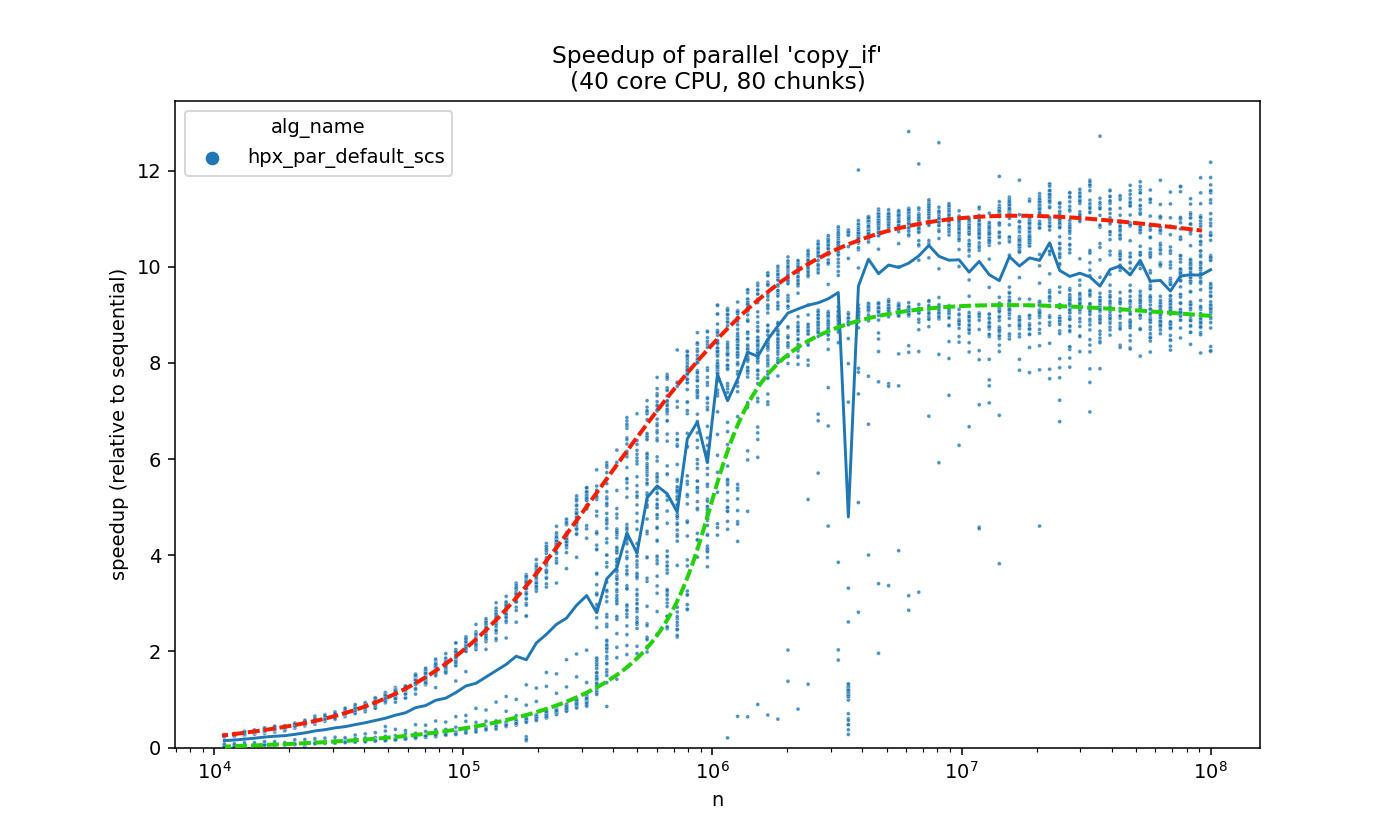
Later on, we realized that seeing the individual data points (instead of just the average-line) can be very valuable.
In the above example, notice the bi-modal distribution.
Instead of being “gathered” around the average, the data points split into two seperate lines, with the average falling somewhere in between.
Also take a look at the following:
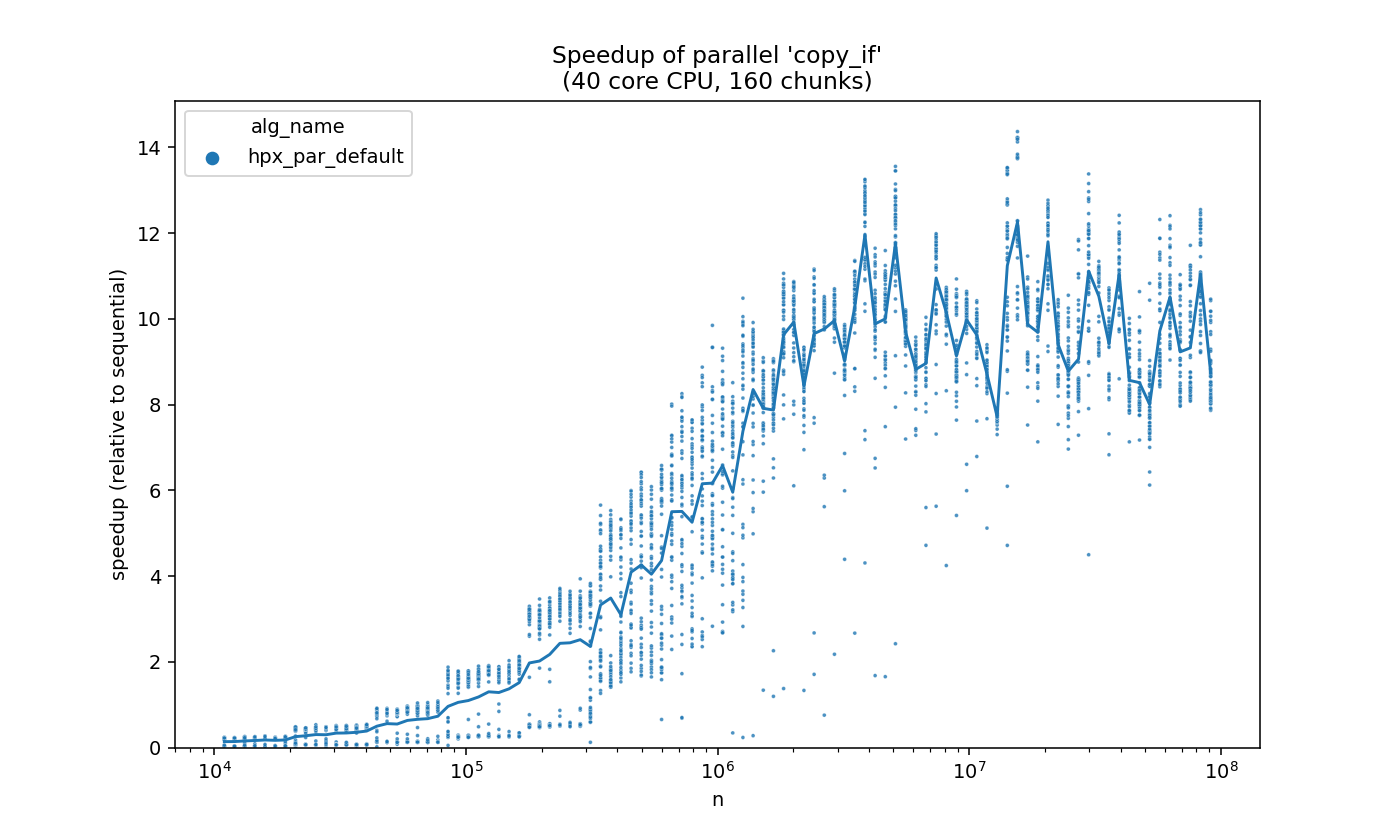
On the left-most side, we can observe a peculiar step-like pattern (which is probably caused by a quantized grain-size policy).
A lot of similar observations (expected and unexpected) were made.
Such observations would be missed if we only viewed the averaged line, and they can lead us to points of interest. Afterwards, we can examine (using debugging and profiling) what makes good runs run well, and what makes bad runs run slow.
Task visualization
Viewing how parallel tasks are distributed (“scheduled”) to available threads, can also be very useful for troubleshooting and improving performance. We used Intel VTune, which was already partly incorporated in HPX.
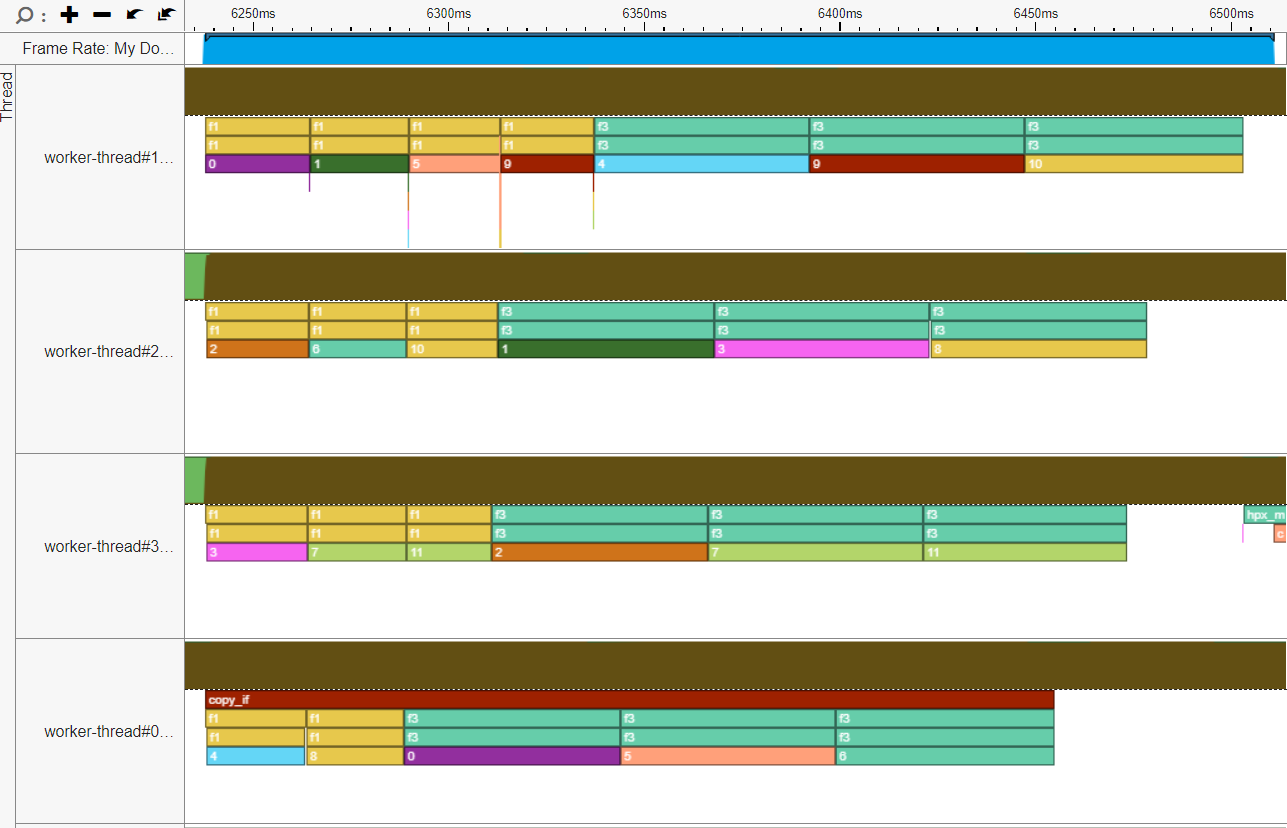
Take a look at the example below:
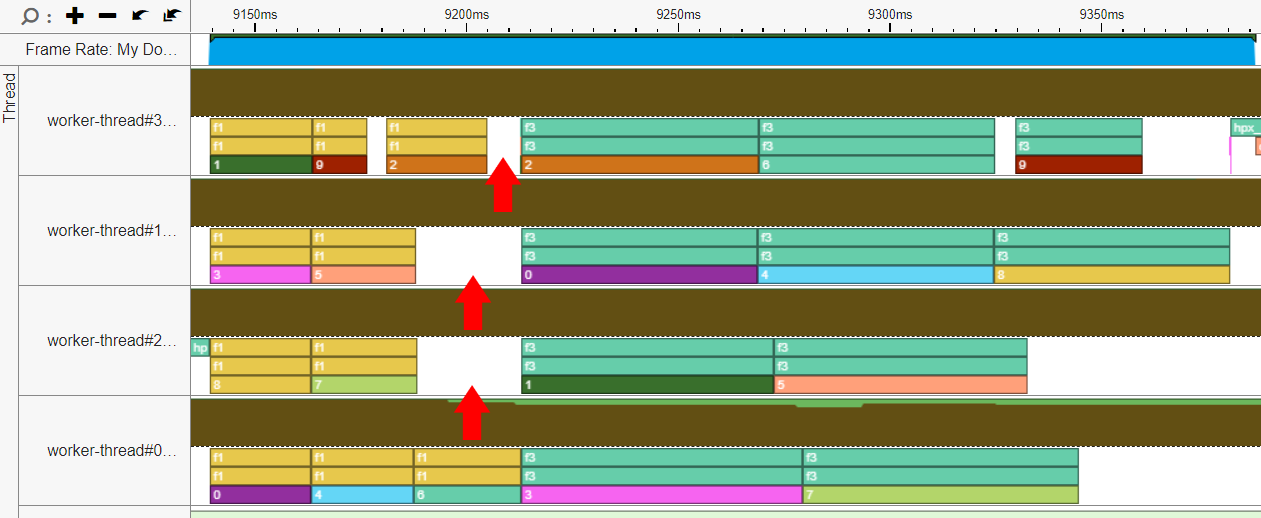
In the above proccess, we have two types of tasks, F1 (yellow) and F3 (green). Due to the nature of this implementation, F3 tasks have to wait for all F1 tasks to finish before starting.
That is a source of inefficiency, because the first three cores aren’t doing any useful work until the last core finishes with the last F1 task (red arrows).
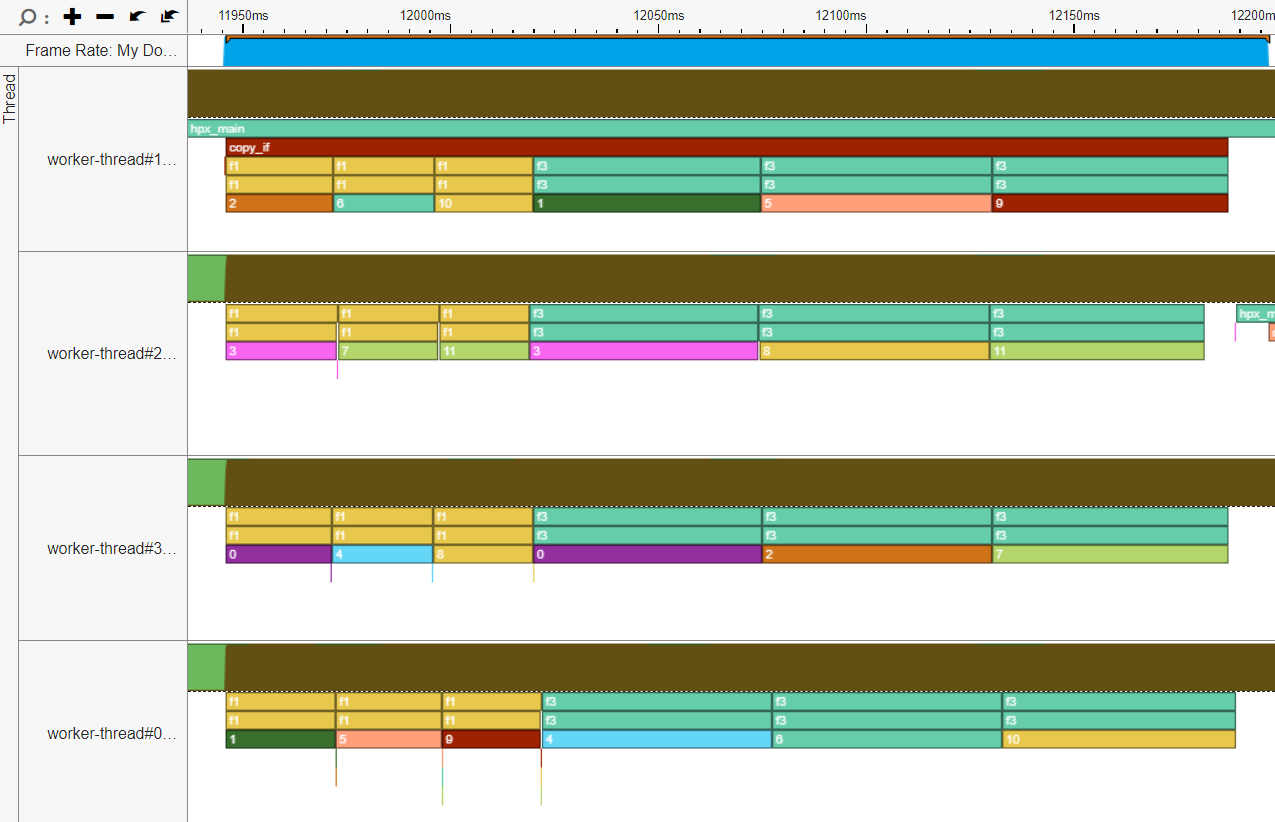
We can try fixing this:
We changed the implementation, such that F3 tasks don’t have to wait for all F1 tasks. Thus, cores aren’t left starving for work.
We can also distribute the work more evenly, so that all cores finish working together:
Note:
Those changes actually made the implementation run slower in some cases, because of additional overhead!
As a result, they are not included in a PR yet.
Future Work
This project has lit many paths for future work to take place. Here are a few ideas:
- Actually commit an improved algorithm (which was the initial goal for this project).
- Use developed processes to compare efficiency of different parallelism paradigms (for example, futures vs senders-receivers).
- Use developed processes to explore properties of SIMD-accelerated operations